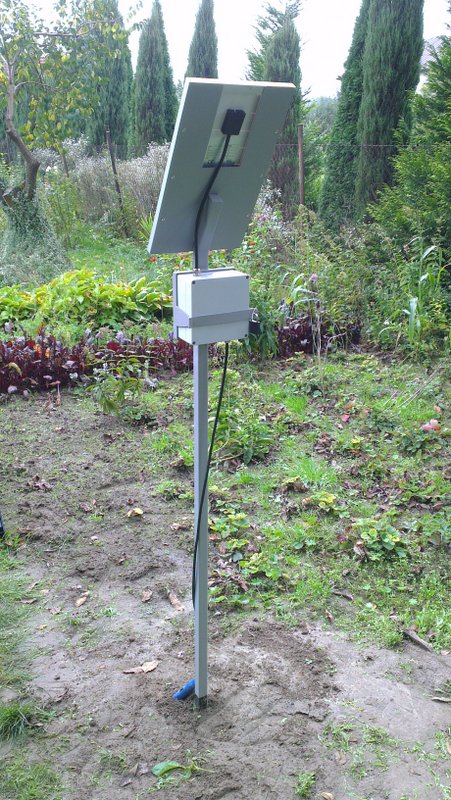
Solar panel, probe and main unit is part of my balcony landscape for over a year now. This setup is running from many weeks to several months uninterruptedly depending purely on firmware upgrades. Field tests being final proof are needed though mainly to simulate shallow running water in freezing weather conditions. This is why two stations were deployed before this winter.
Main unit box survived last winter with weeks of cloudy weather and freezing cold, as well as unbelivable hot periods in summer of 2014. From the very beginning my main concern was freezing of water that may lead to heavy overpressure damaging sensor. While total freeze of deep rivers is rare, creeks in highland areas are so shallow they may get icy every winter.
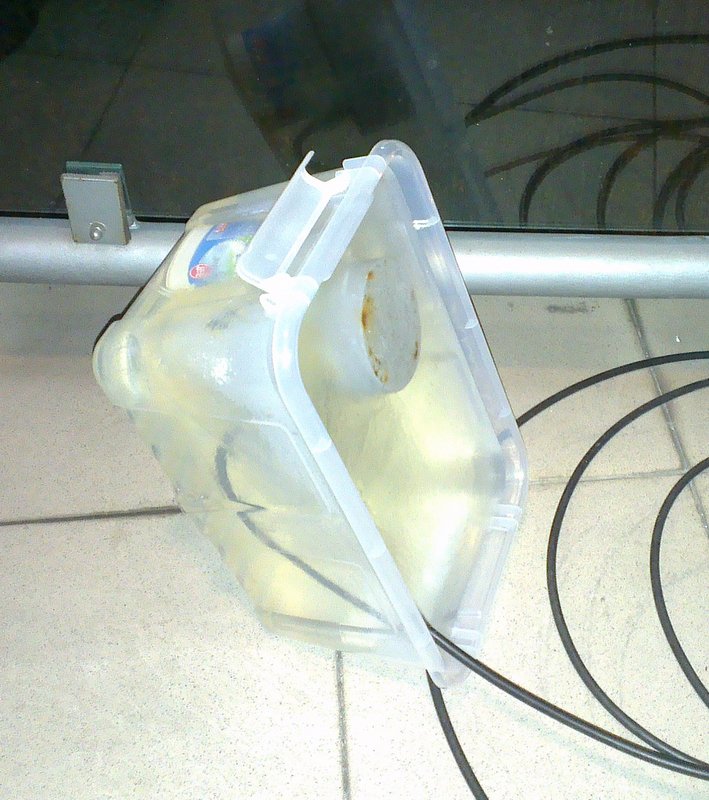
Almost frozen sensor

5cm of ice on top of sensor
Still water freezing overpressure
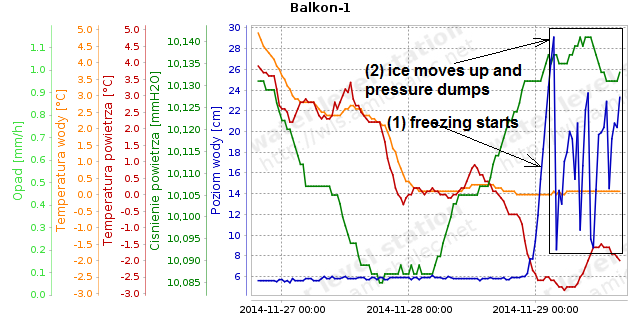
I do not have any expertise in physics of freezing especially for water streams where crystalization is intuitively different than in still water. Still water in basket on balkony started crystalization from the surface locking and squizing water inside. Fortunatelly angled walls of basket allowed ice block to slide along the walls, moving up couple times causing pressure drops. On attached picture it can be observed as blue line of level (near 6cm of water) that at some point starts quickly climbing up nearly to 30cm (pressure caused by icing) to drop and rise again couple times. After that I decided to stop experiment obviously leading to sensor damage.
First test location
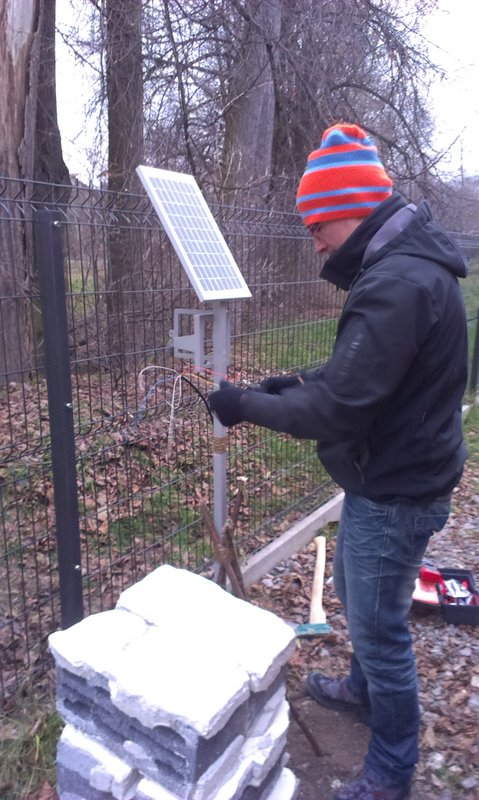
Second test location
Sensor in shallow creek
To get real tests together with my brother we deployed two stations: one in medium-size stream (60-70cm of water) and second station in shallow 15cm creek. Both stations are placed on private fenced lands to keep it safe from vandals and thieves.
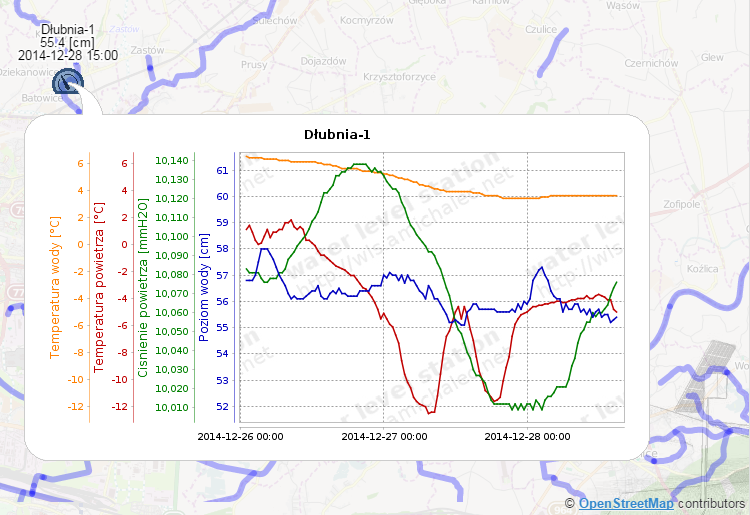
Stations map with recent data
As of today they are fully operational nearly for 3 and 2 months respectively and data is being collected in central database. In parallel I develop visualisation software to get more user-friendly interface to show real value to potential customers; examplary screenshot with real data attached aside.
Now I am waiting for harsh January 2015 as December was surprisingly warm, except for last couple days of weather breakdown with temperatures dropping from +10C to -8C.
See also other related articles:
[posts_by_tag tag=”WLS”]


